HowTo: Visualize data distribution - Linear-Regression with TensorFlow
1. Using Jupyter Notebook (Python)
Step 1. Sign in TWSC
- If you don’t have an account yet, please refer to Sign up for TWSC.
Step 2. Create an Interactive Container
- Please refer to Interactive Container to create an Interactive Container, and select TensorFlow for the image type (For image, please select a version with Python 2 before 19.08 (
not including 19.08)).
Step 3. Connect to the Container
- Use Jupyter Notebook to connect the container and add a Python 2 notebook.
info
Step 4. Execute Linear-Regression program
- Copy and paste the following code to Jupyter Notebook.
%matplotlib inline
import tensorflow as tf
import numpy as np
import matplotlib.pyplot as plt

# Use numpy to generate 100 random points
x_data = np.random.rand(100).astype(np.float32)
y_data = x_data * 0.1 + 0.3

# Try to find values for W and b that compute y_data = W * x_data + b
# (We know that W should be 0.1 and b 0.3, but TensorFlow will
# figure that out for us.)

W = tf.Variable(tf.random_uniform([1], -1.0, 1.0))
b = tf.Variable(tf.zeros([1]))
y = W * x_data + b

# Minimize the mean squared errors.
loss = tf.reduce_mean(tf.square(y - y_data))
optimizer = tf.train.GradientDescentOptimizer(0.2)
train = optimizer.minimize(loss)

# Before starting, initialize the variables.  We will 'run' this first.
init = tf.global_variables_initializer()

# Launch the graph.
sess = tf.Session()
sess.run(init)

# Fit the line.
for step in range(201):
    sess.run(train)
    if step % 20 == 0:
        print(step, sess.run(W), sess.run(b))
        plt.plot(x_data, y_data, 'ro', label='Original data')
        plt.plot(x_data, sess.run(W) * x_data + sess.run(b), label='Fitted line')
        plt.legend()
        plt.show()

# Learns best fit is W: [0.1], b: [0.3]
- Click Run.

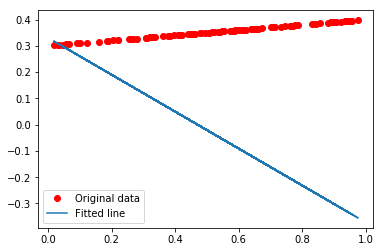
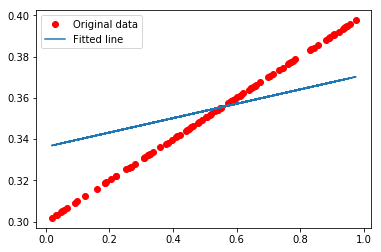
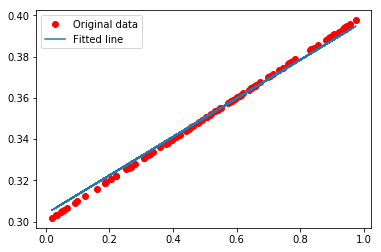
Step 5. Visualize data distribution
- TensorFlow will slowly find the fitting weights and draw a linear regression line.
2. Using SSH or Jupyter Notebook (Terminal) for connection
info
💡 The following example is based on the official TensorFlow tutorial.
Step 1. Using SSH to log in or open Jupyter Notebook (Terminal)
info
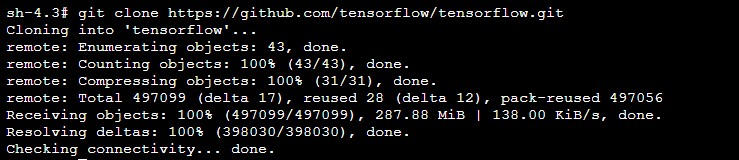
Step 2. Download the TensorFlow program from GitHub
git clone https://github.com/tensorflow/tensorflow.git
Step 3. Switch to branch Tensorflow 1.10
cd tensorflow && git checkout r1.10

Step 4. Switch to the example/regression directory
cd tensorflow/examples/get_started/regression
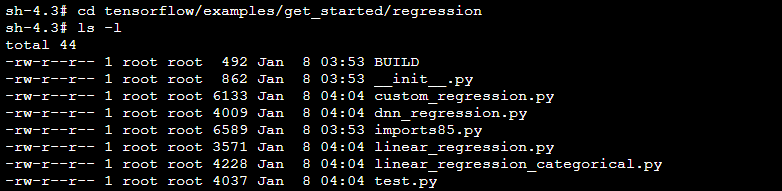
Step 5. Run the sample program using Python commands
python linear_regression.py
- The following message will be output during the computation:
- Check point directory: You can use the TensorBoard tool to visualize neural networks and analyze training trends
- The loss value after every 100 iterations, which helps to determine whether the model training has converged
