HowTo:視覺化呈現資料分佈-用 TensorFlow 實作 Linear-Regression
1. 使用 Jupyter Notebook (Python)
Step 1. 登入 TWSC
若尚無帳號,請參考 註冊 TWSC 帳號。
Step 2. 建立開發型容器
請參考 開發型容器 建立開發型容器,映像檔類型請選擇 TensorFlow (映像檔請選擇 19.08 以前 (含 19.08),且 Python 2 的版本)
Step 3. 連線進入 Container
- 使用 Jupyter Notebook 連線容器,新增 Python 2 notebook
信息
參見連線容器
Step 4. 執行 Linear-Regression 程式
- 複製貼上以下程式碼內容至 Jupyter Notebook
%matplotlib inline
import tensorflow as tf
import numpy as np
import matplotlib.pyplot as plt

# 用 numpy 亂數產生 100 個點
x_data = np.random.rand(100).astype(np.float32)
y_data = x_data * 0.1 + 0.3

# Try to find values for W and b that compute y_data = W * x_data + b
# (We know that W should be 0.1 and b 0.3, but TensorFlow will
# figure that out for us.)

W = tf.Variable(tf.random_uniform([1], -1.0, 1.0))
b = tf.Variable(tf.zeros([1]))
y = W * x_data + b

# Minimize the mean squared errors.
loss = tf.reduce_mean(tf.square(y - y_data))
optimizer = tf.train.GradientDescentOptimizer(0.2)
train = optimizer.minimize(loss)

# Before starting, initialize the variables.  We will 'run' this first.
init = tf.global_variables_initializer()

# Launch the graph.
sess = tf.Session()
sess.run(init)

# Fit the line.
for step in range(201):
    sess.run(train)
    if step % 20 == 0:
        print(step, sess.run(W), sess.run(b))
        plt.plot(x_data, y_data, 'ro', label='Original data')
        plt.plot(x_data, sess.run(W) * x_data + sess.run(b), label='Fitted line')
        plt.legend()
        plt.show()

# Learns best fit is W: [0.1], b: [0.3]
- 點擊 「Run」
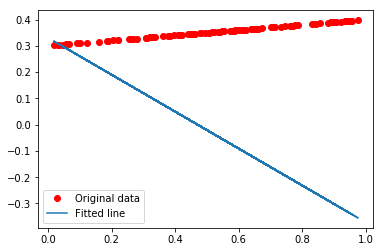
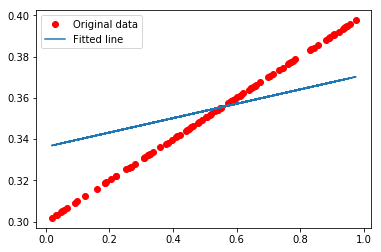
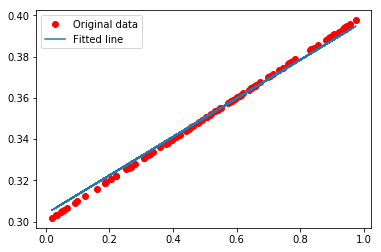
Step 5. 資料分佈視覺化呈現
- TensorFlow 會慢慢地找出 fitting 的權重值並繪製線性迴歸線
2. 使用 SSH 或 Jupyter Notebook (Terminal)
信息
💡 以下範例參考自 TensorFlow 官方教學
Step 1. 利用 SSH 登入方式或開啟 Jupyter Notebook (Terminal)
信息
參見連線容器
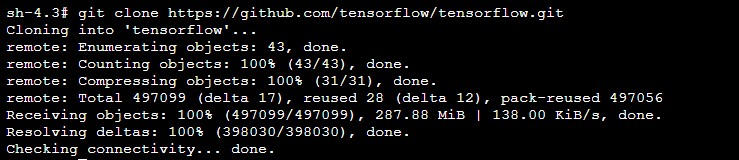
Step 2. 從 GitHub 下載 TensorFlow 程式
git clone https://github.com/tensorflow/tensorflow.git
Step 3. 切換 Tensorflow 分支至 1.10
cd tensorflow && git checkout r1.10

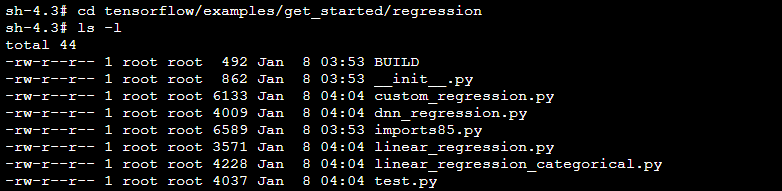
Step 4. 切換至 example/regression 目錄
cd tensorflow/examples/get_started/regression
Step 5. 使用 Python 指令運行範例程式
python linear_regression.py
- 運算過程中會輸出以下訊息 :
- Check point 目錄 : 可以使用 TensorBoard 工具來視覺化神經網絡及分析訓練趨勢圖
- 每 100 次迭代後的 loss 數值,這有助於確定模型訓練是否有收斂
