HowTo: Monitor your resource-GPU Burn Testing
This tutorial demonstrates how to use GPU stress test tools to check whether the GPU is working properly when the GPU is fully loaded.
The GPU is working normally if the final result is OK, while FAULTY means that there is a problem with the GPU.
Step 1. Sign in to TWSC
- If you don’t have an account yet, please refer to Sign up for TWSC.
Step 2. Create an Interactive Container
- Please refer to Interactive Container to create an Interactive Container.
- Please select TensorFlow for the image type, select an image version that supports tensorflow-21.11-tf2-py3:latest, and select 1 GPU for the hardware.
Step 3. Connect to the container, download the training program
- Use Jupyter Notebook to connect to the container and open Terminal.
info
📖 See Using Jupyter Notebook
- Enter the following command to download the NCHC_GitHub training program to the container.
git clone https://github.com/TW-NCHC/AI-Services.git
Step 4. Perform GPU Burn Testing
- Enter the following command to access the Tutorial_Two directory.
cd AI-Services/Tutorial_Two
- Enter the following command to download GPU_Burn program and start execution.
bash gpu_testing.sh
Step 5. Computing capability
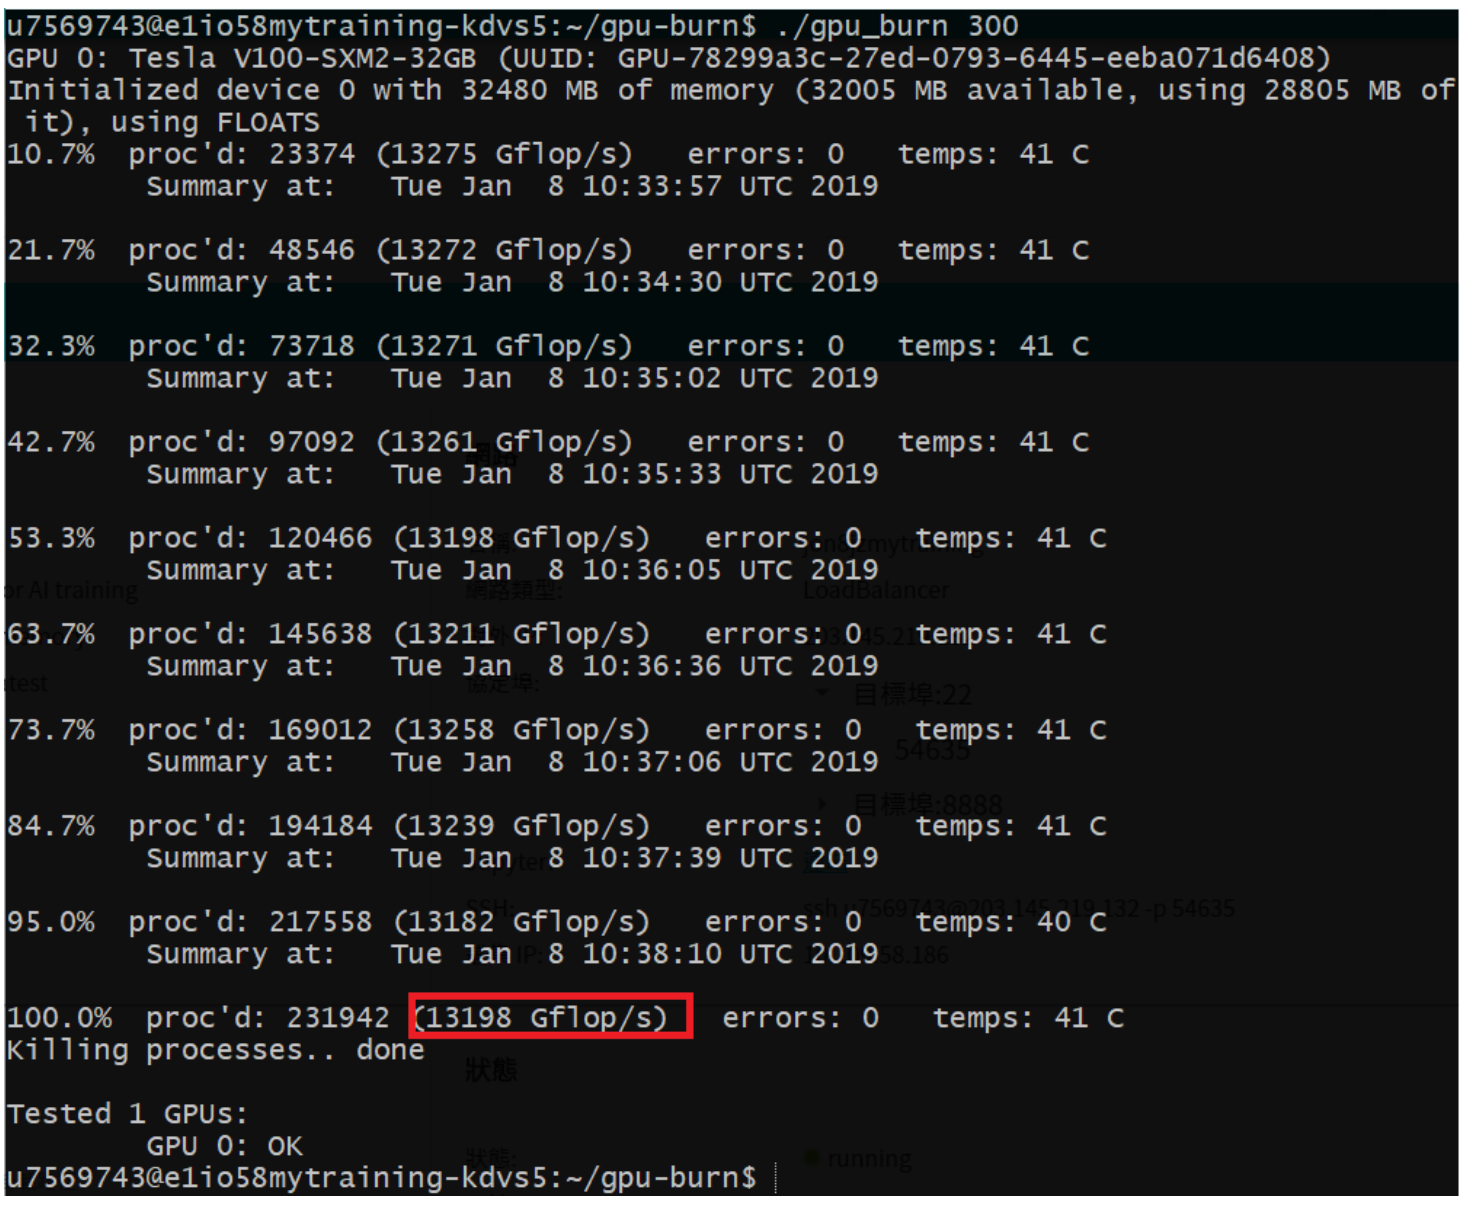
- View computing capability
The GPU used by the GPU container service is NVIDIA V100 32GB, which has powerful computing capabilities. The test running GPU-burn showed that the container has a computing capability of 13198 Gflop/s.
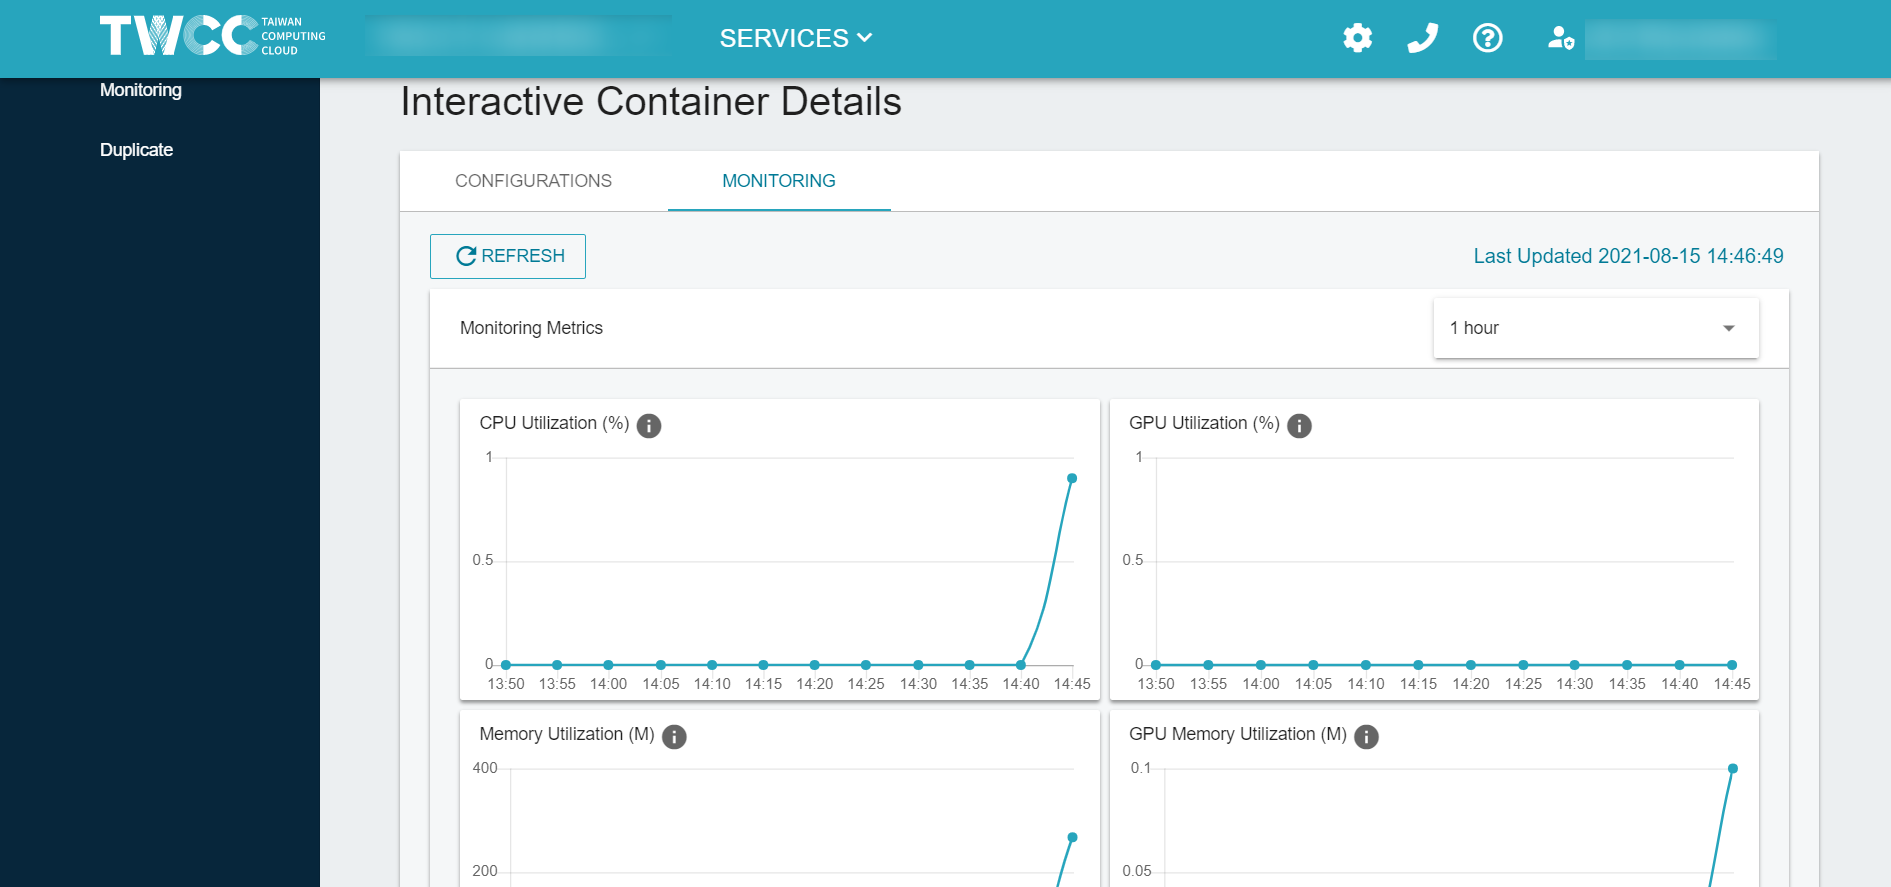
- Monitor Interactive Container
a. Interactive Container monitoring: Utilization of CPU, GPU and memory
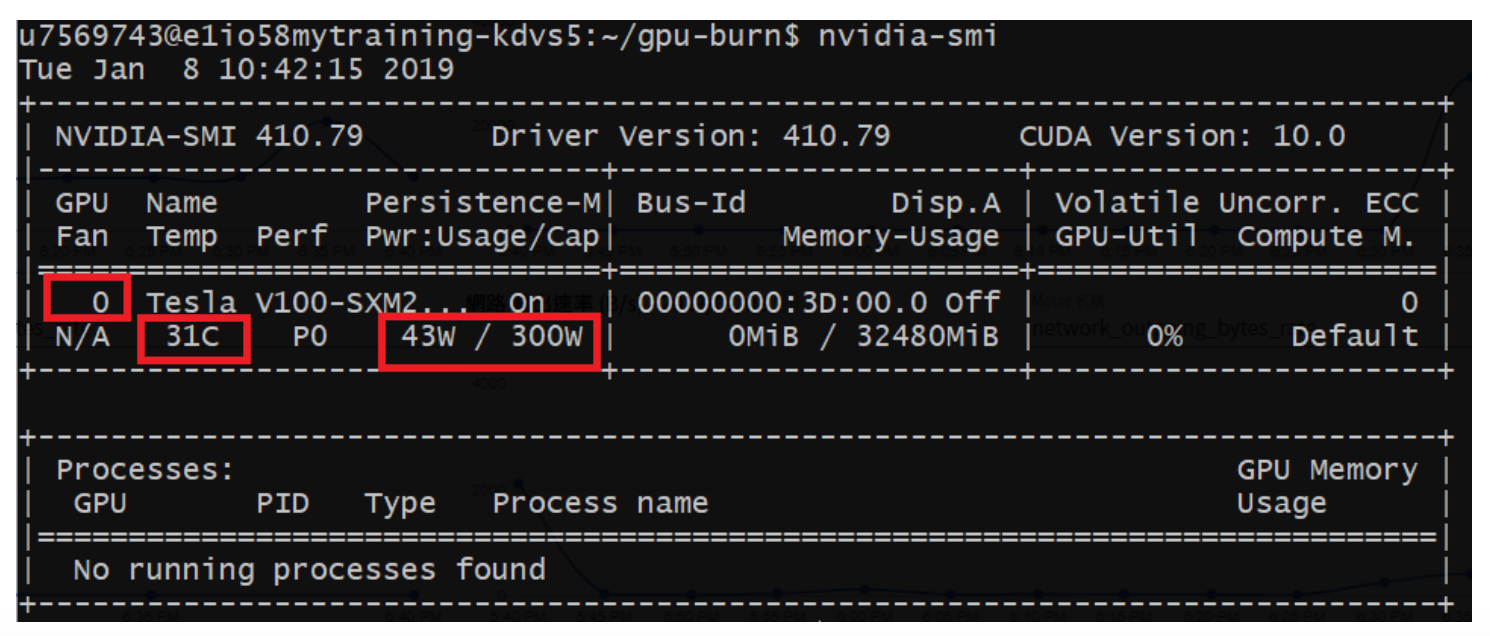
b. In the Terminal of Jupyter Notebook in the container, you can run the following command to monitor the GPU temperature and power.
nvidia-smi
GPU quantity Displayed in increments of number 0, the example in the figure below is 1 GPU
GPU temperature Displayed in Celsius, the example in the figure below is 31 degrees C
GPU power usage Displayed in wattage, the example in the figure below is 43W