Monitor an instance
TWSC portal allows you to view the monitoring information of Virtual Compute Service (VCS) instances, including CPU Utilization, Memory Utilization, Disk Read/Write rate and Network output rate.
info
- For the permission differences between a Tenant Admin and a Tenant User when using VCS instances, please refer to User roles and permissions.
- TWCC CLI currently does not support this feature.
Monitoring metrics
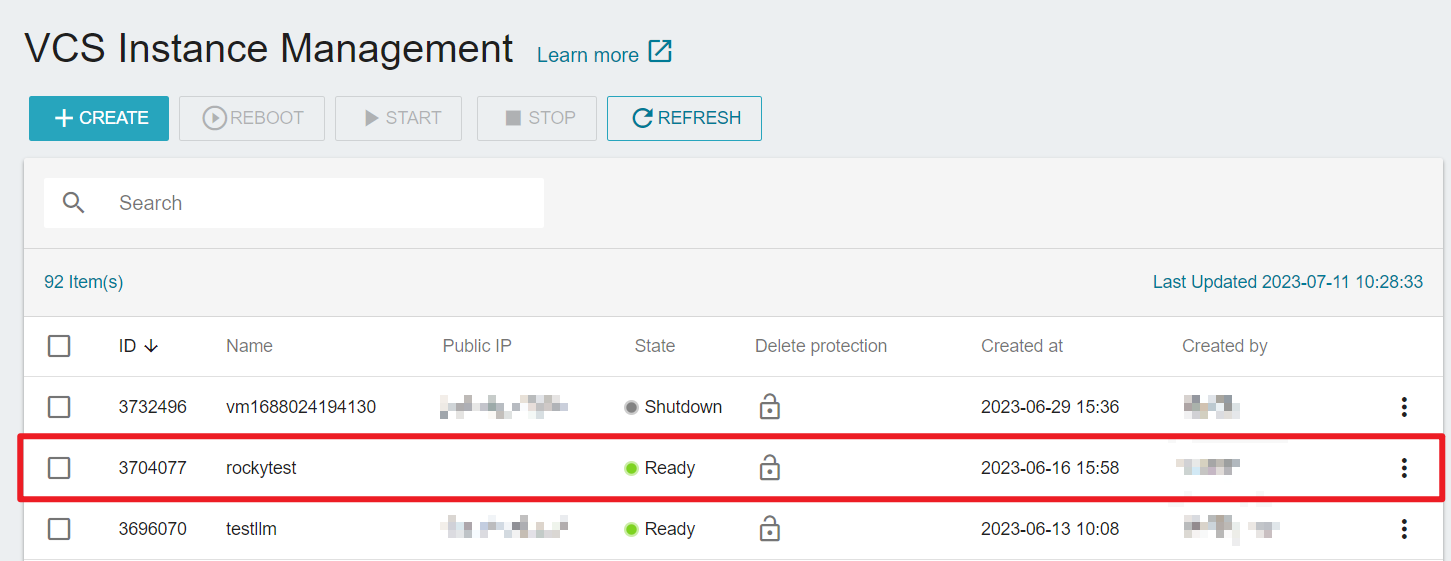
- Go to the VCS Instance Management page, and select an instance.
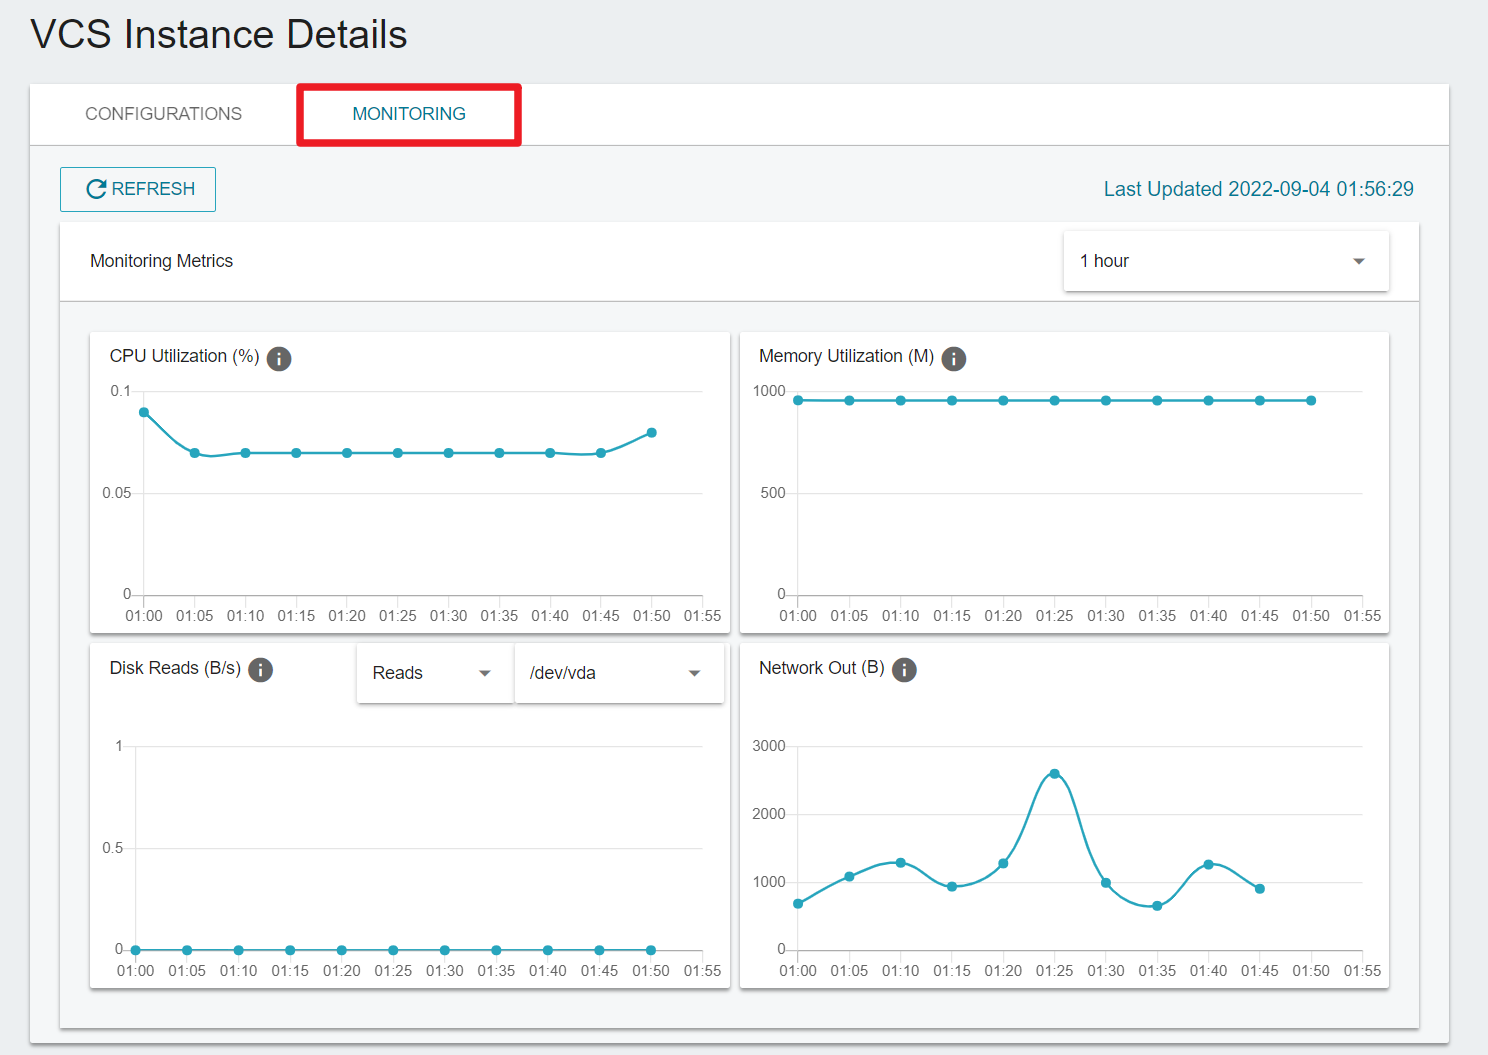
- Select the Monitoring tab on the VCS Instance Details page to view the instance monitoring metrics:
- CPU Utilization(%): CPU usage over the time period For example, 2 (200%) means 2 CPUs are used up.
- Memory Utilization(MB): memory usage, in Megabytes (MB).
- Disk Reads(B/s): The read/write rate of each disk in Bytes/second (B/s).
- Network Out(B): The external network traffic of the VCS instance, a combination of east-west traffic (horizontal transmission between VCS instances) and north-south traffic (traffic between the client and the VCS instance). The unit is Bytes (B).
info
Network traffic on TWSC portal includes the sum of east-west traffic and north-south traffic, while the quota and resource usage records in the Member Center only show north-south traffic.
Monitoring settings and chart download
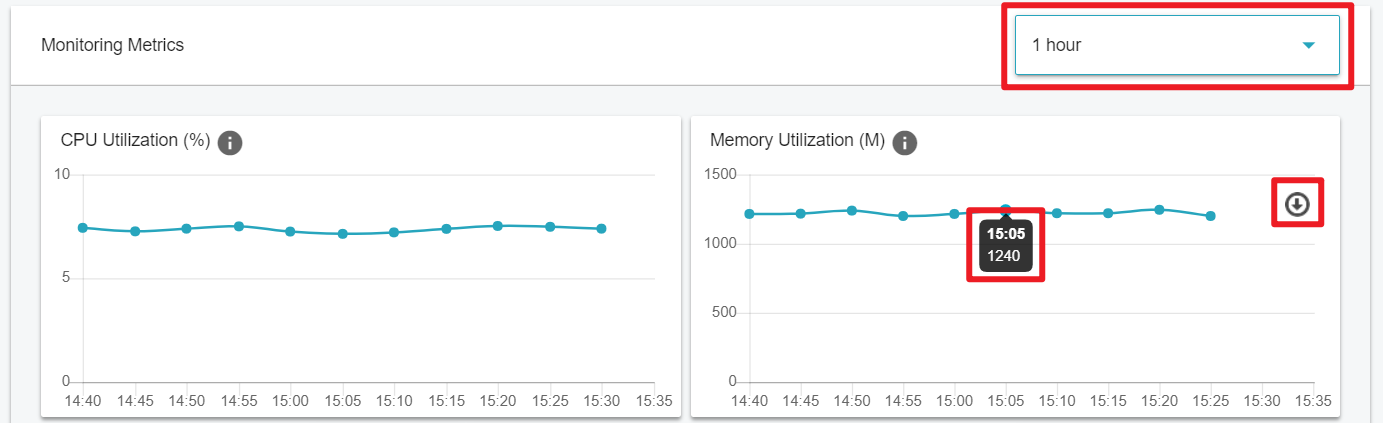
- Move the cursor to the green dot to get the actual value.
- Move the cursor to any monitoring chart, click the icon to download the monitoring chart file (
.png) . - From the menu on the right side, you can select the time to observe the changes of the container resource usage within the specific time period.
info
The specific duration can be selected from 1 hour, 6 hours, 12 hours, 1 day, 7 days, and 30 days.